All work Case Study Credit Research AI-Native Publishing
Pulse Ratings

An AI-native
credit rating product,
built in two passes.

We built a data-driven deep-analysis engine that reads a public company's filings, earnings calls, news, and industry signals — then writes a credit opinion complete with tear sheet, trend charts, scenario modeling, and a management-credibility read. Then we did it again, shipping it inside a real client's existing research publication.

Client Credit-research
publication (confidential)
Domain Public-company
credit analysis
Demonstrated on AMC Entertainment
public filings
Works for Any public
retailer or company
The Transformation

Two prototypes, one engine.
Same analysis, completely different product.

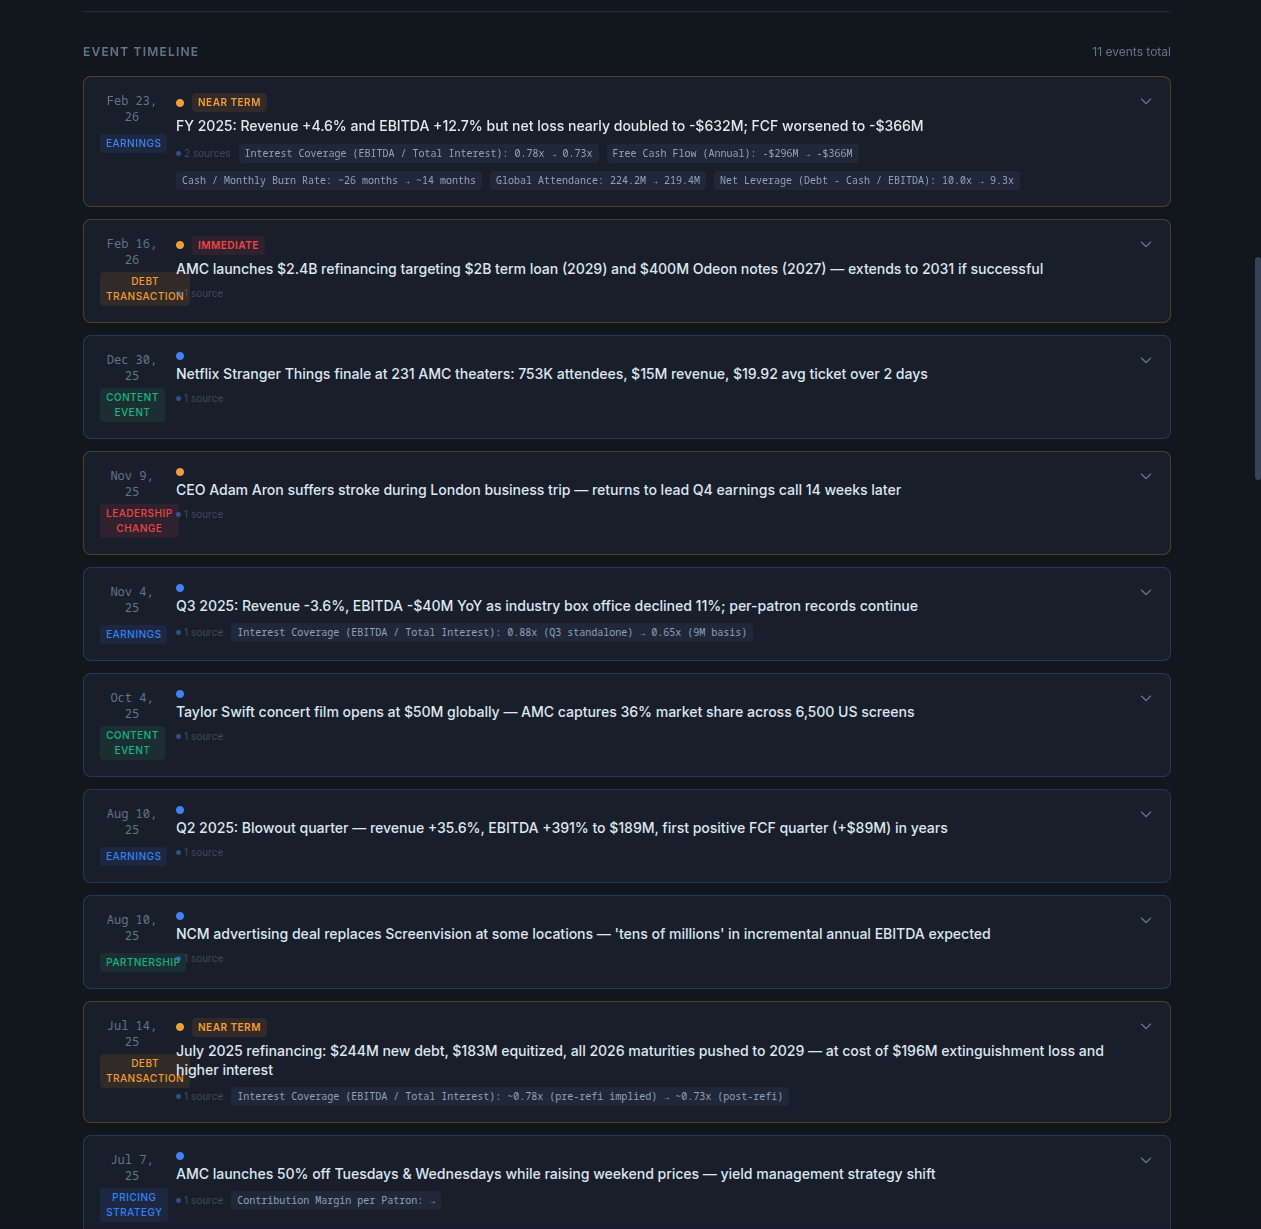
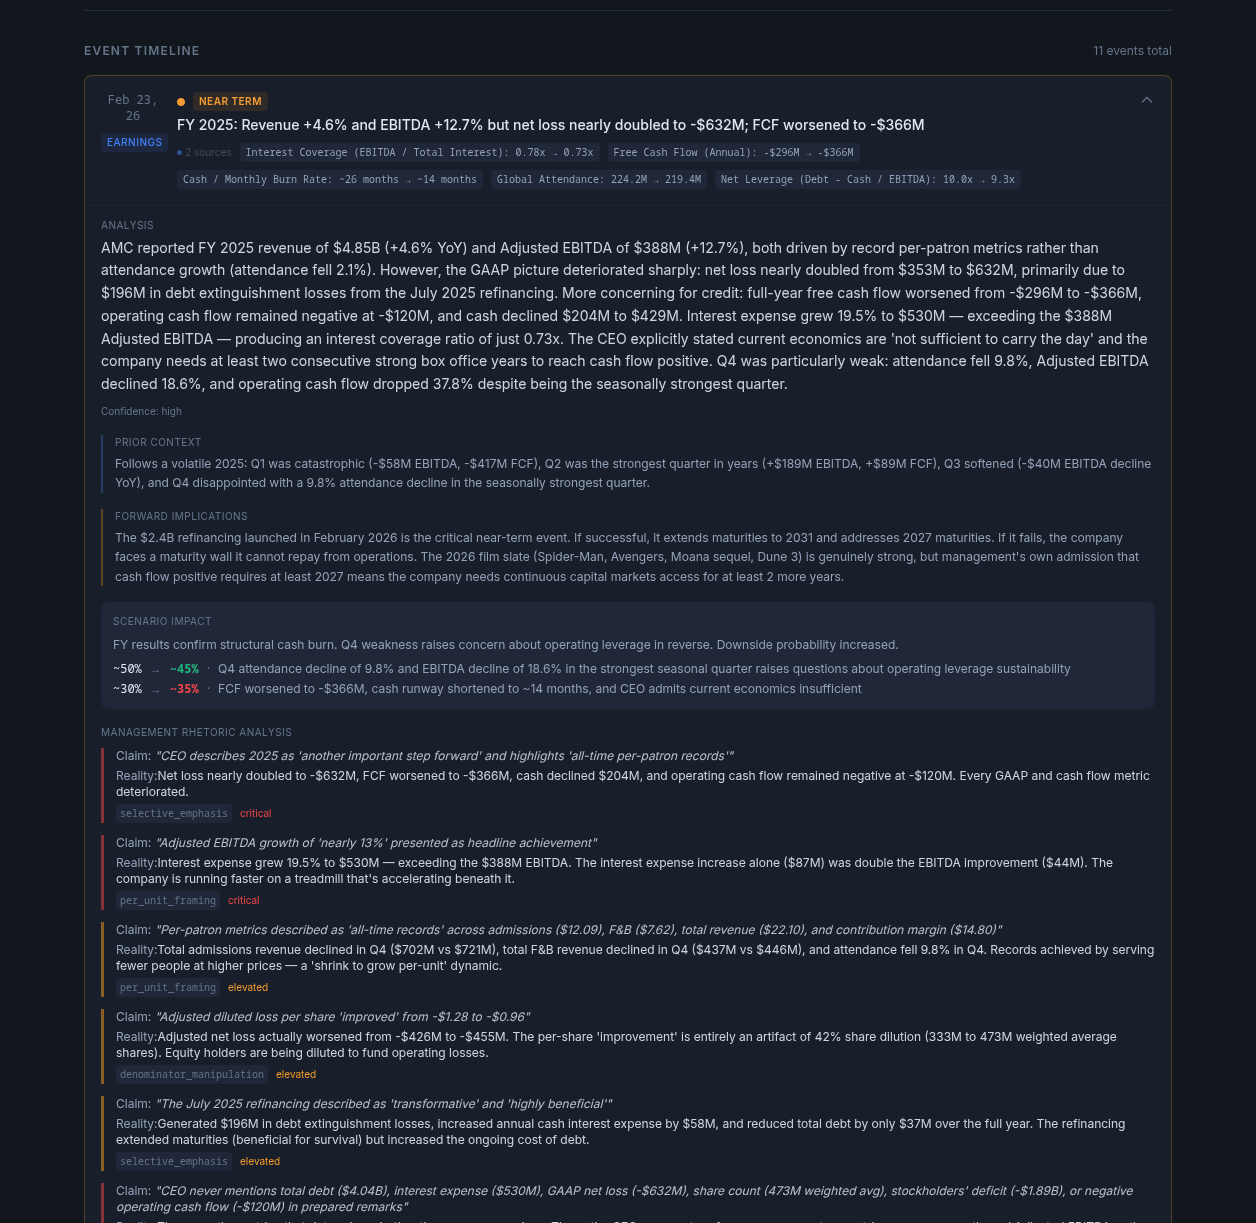
We started by building the analytical engine as its own opinionated product — a dark, AI-forward scorecard that shows what a modern credit workstation could look like if it were designed from scratch around AI-generated reasoning. Then we took that same engine and re-skinned it as a publication-grade credit report, slotted into an existing publisher's site, reader base, and editorial voice.

Prototype 01 · Engine-First

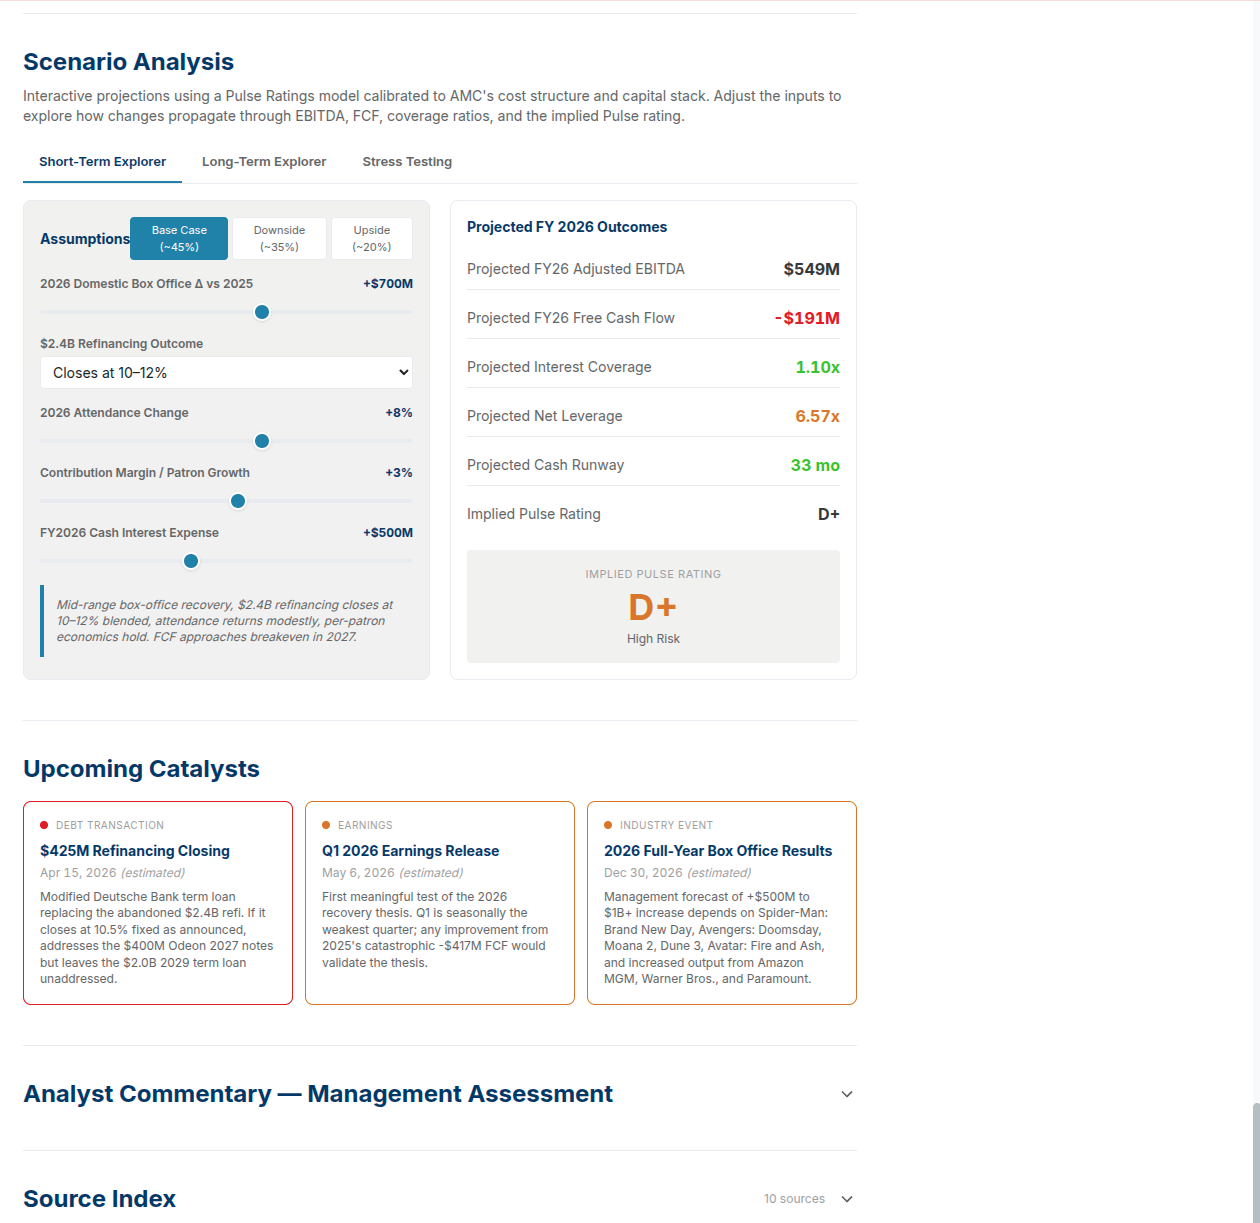
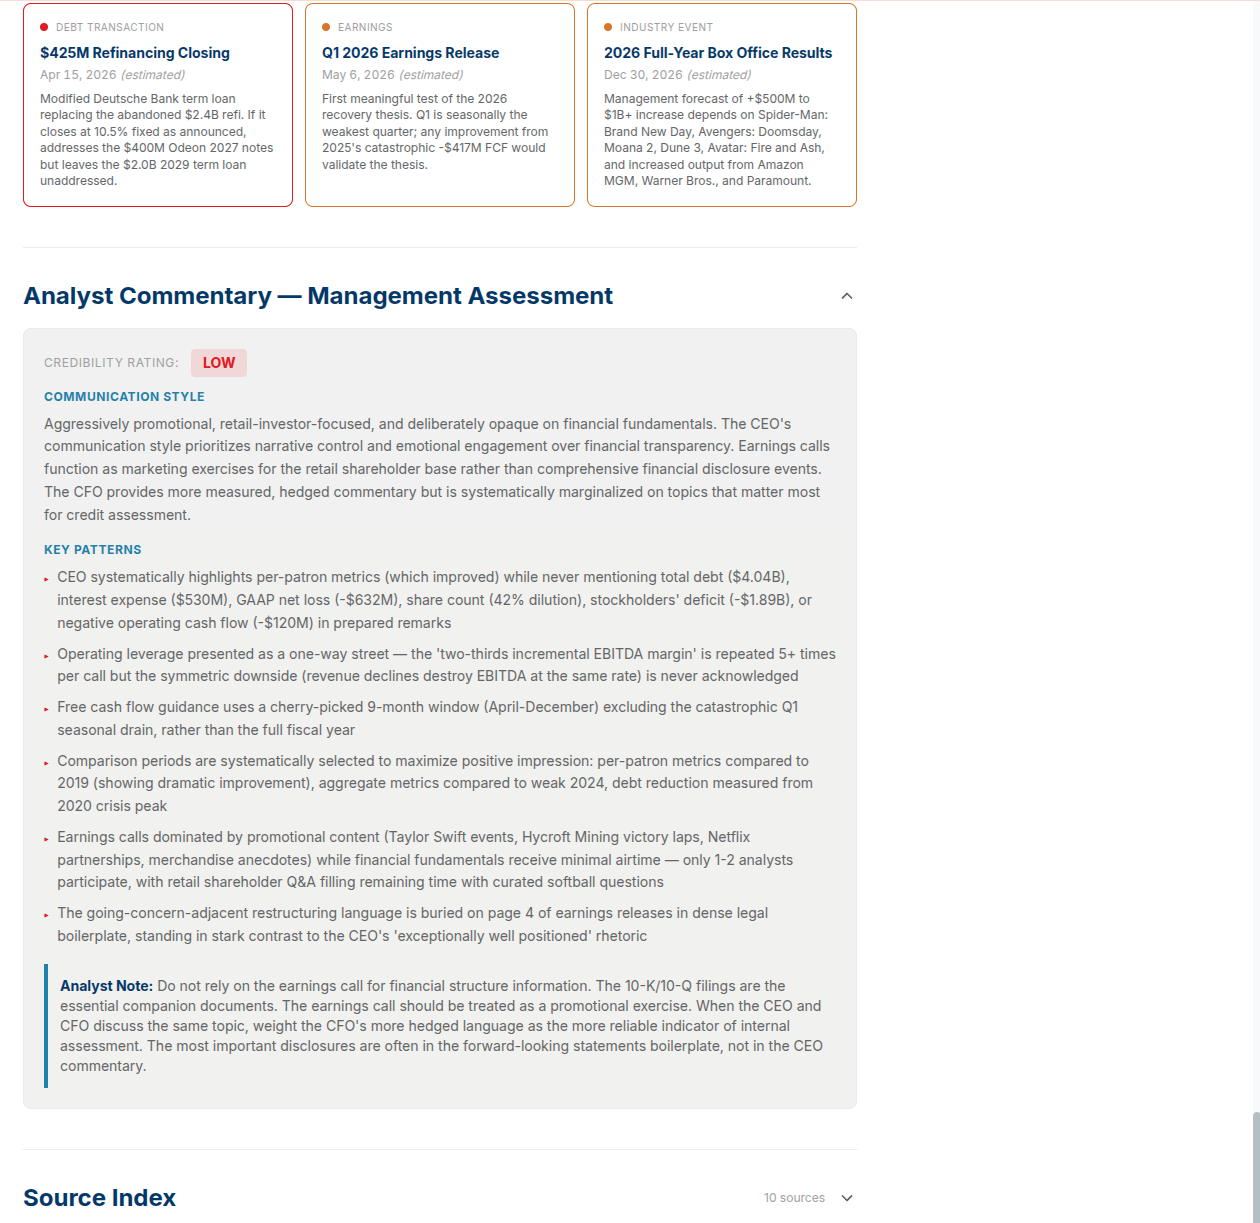
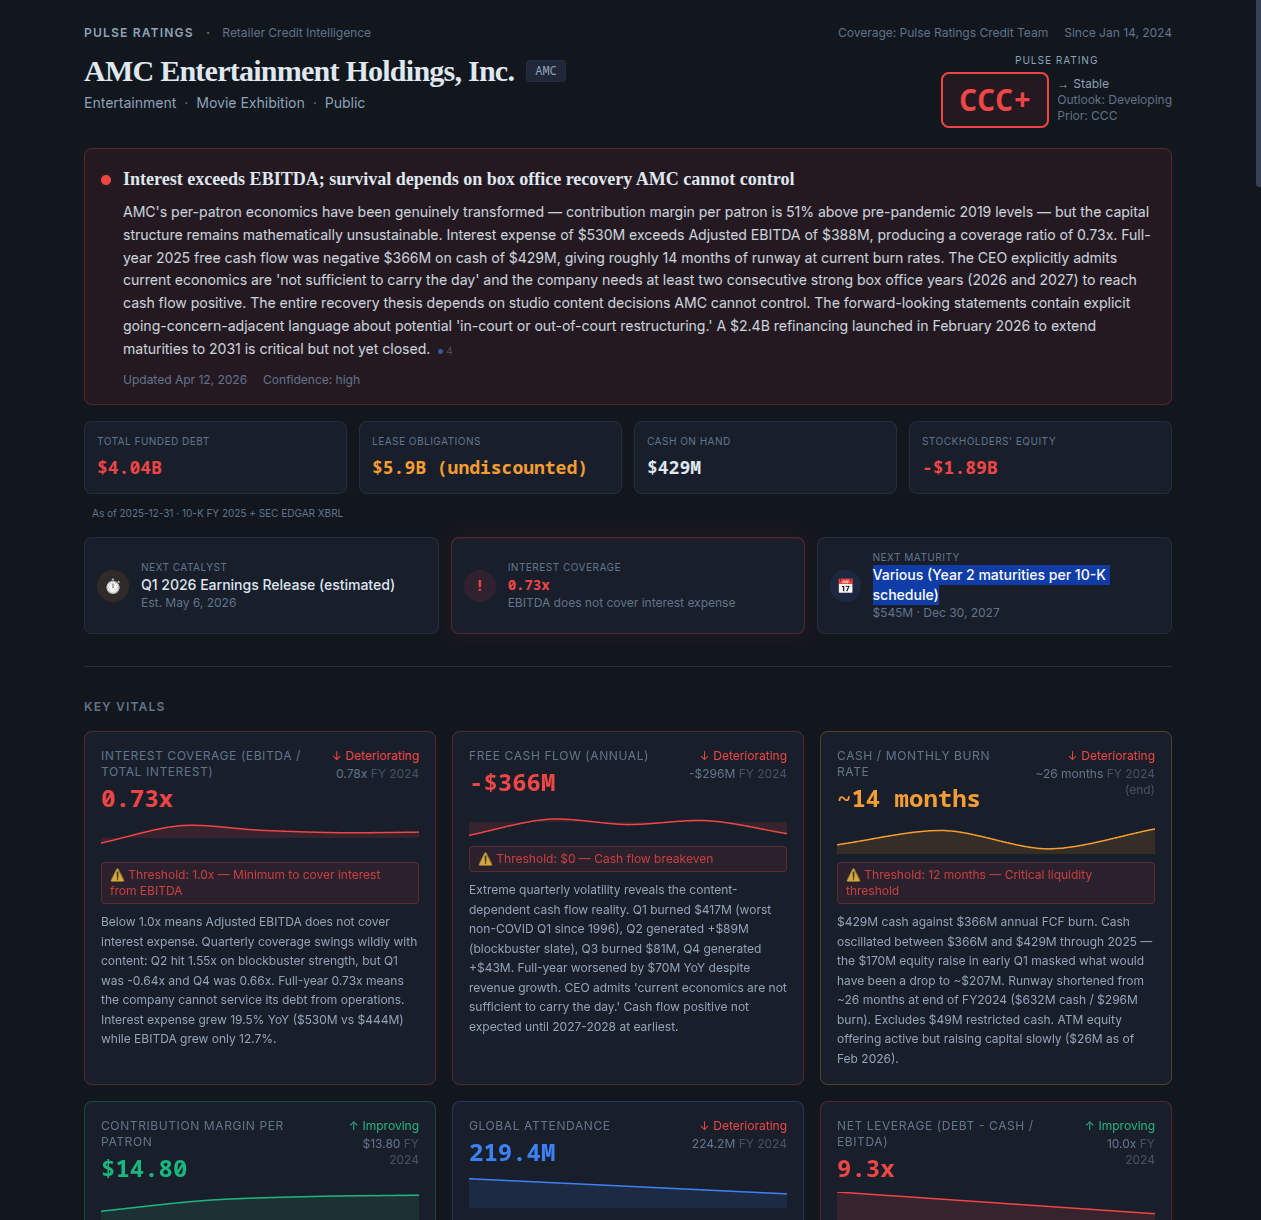
A standalone AI credit workstation.

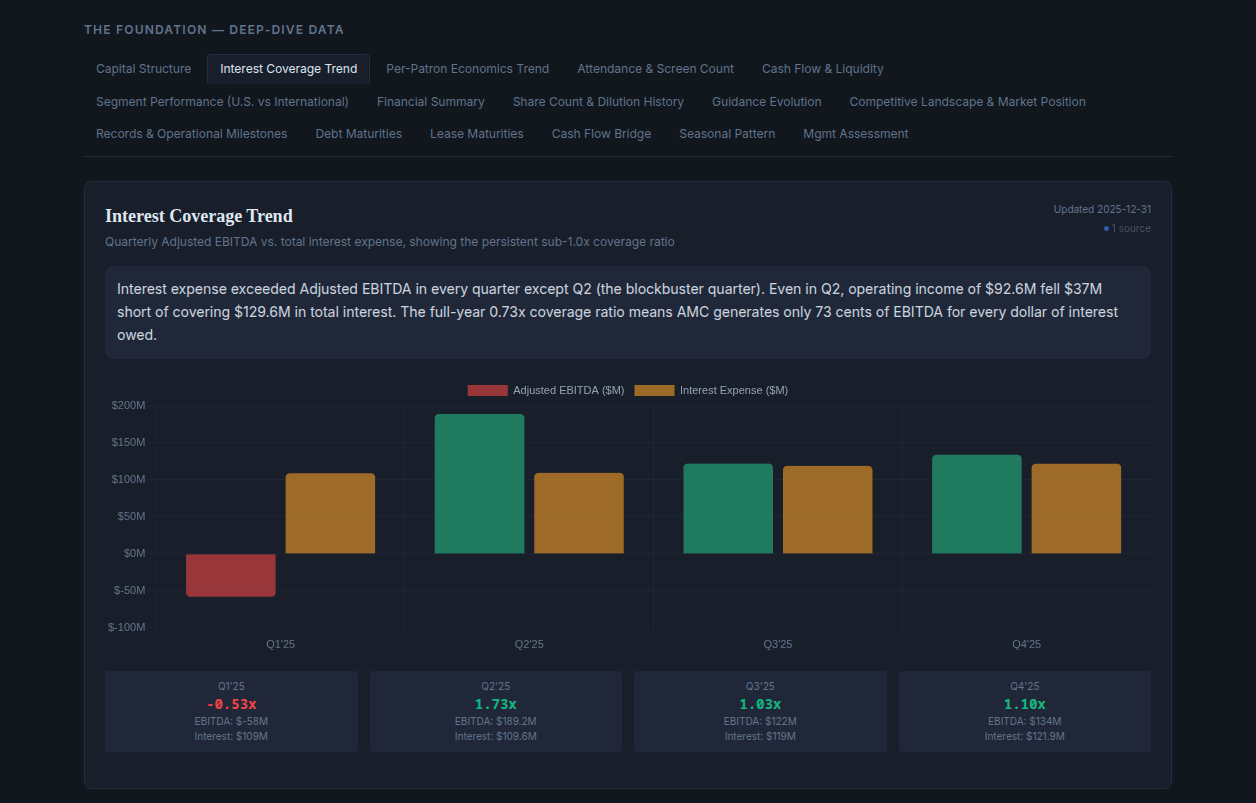
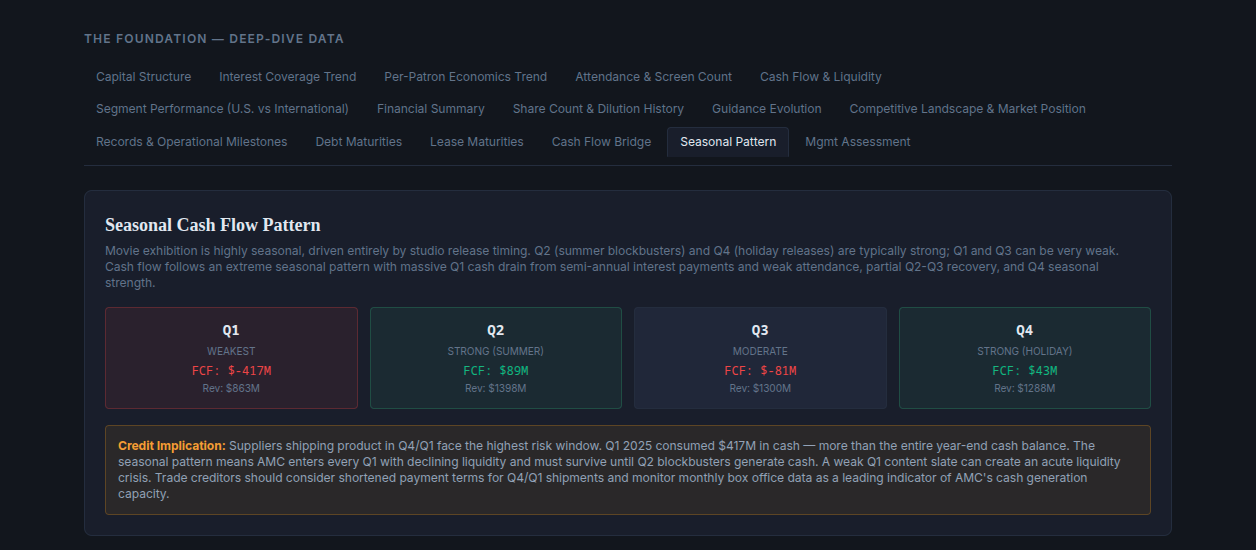
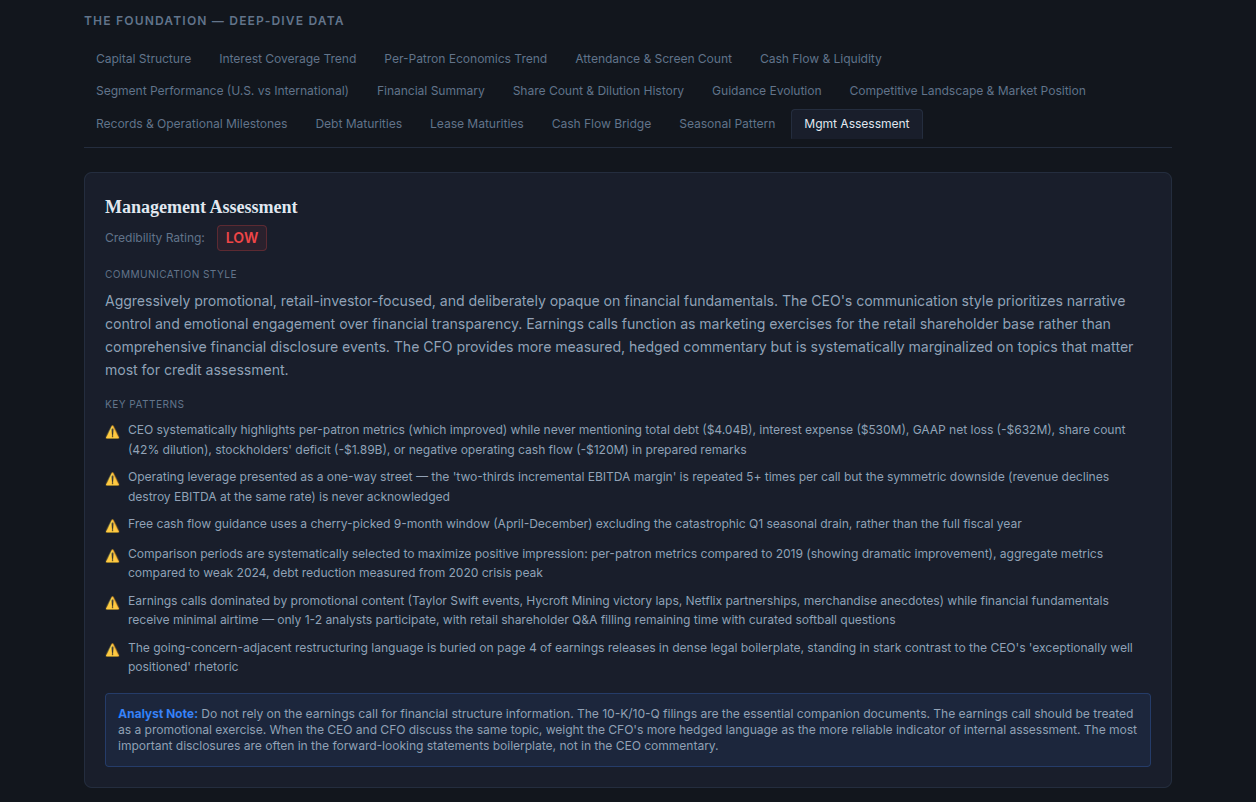
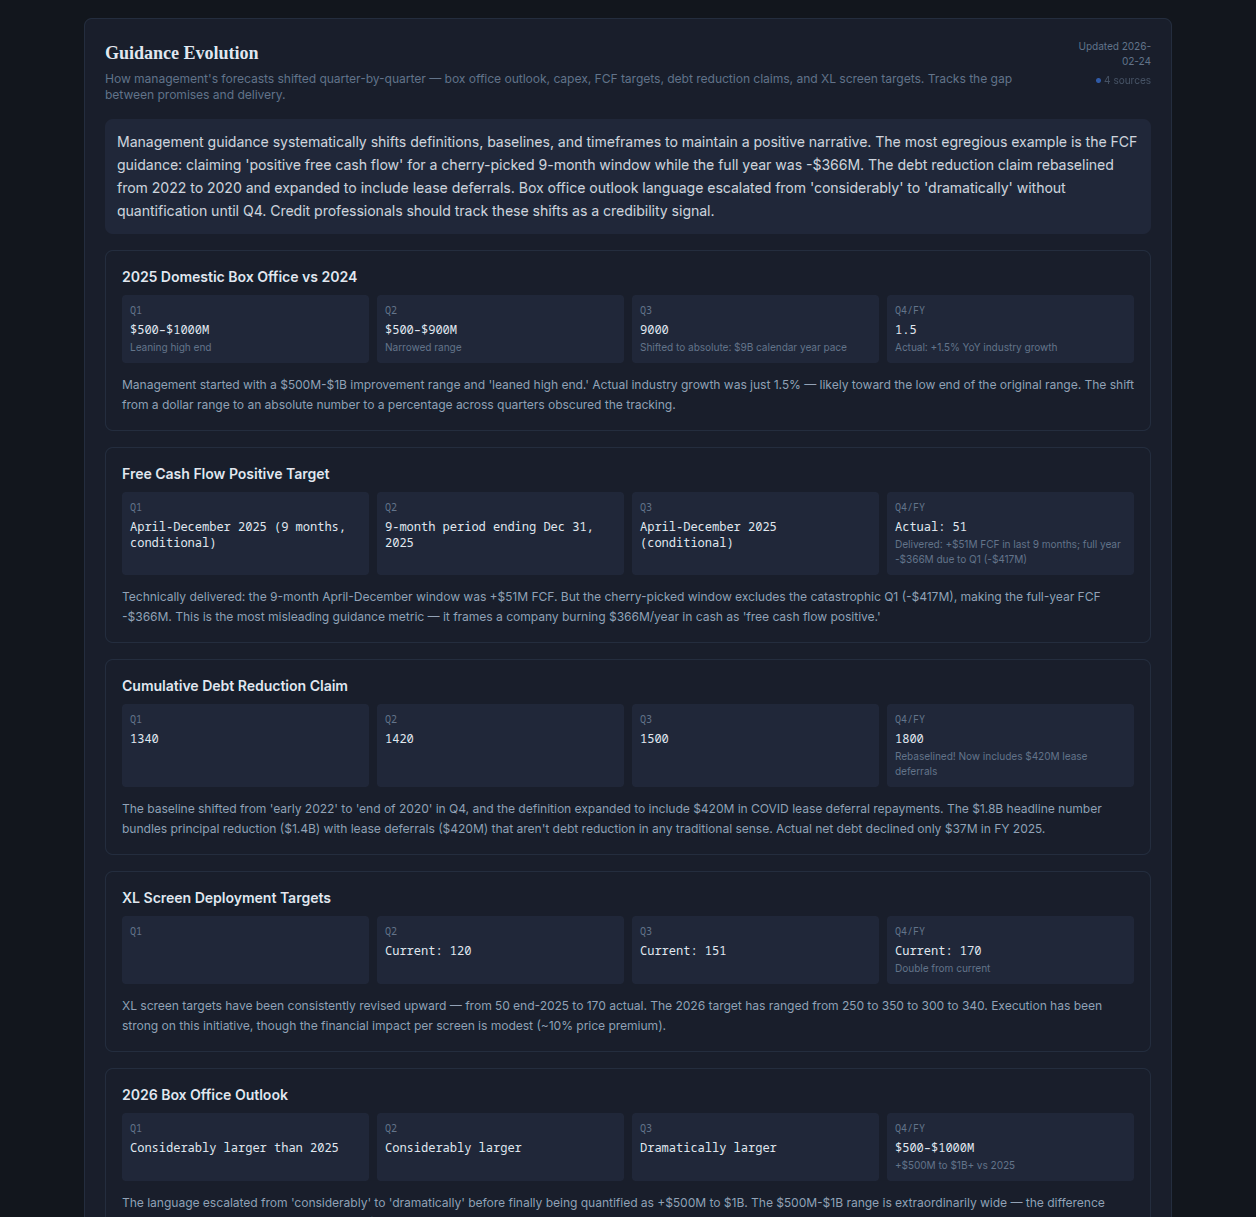
Dark, dense, designed around the analytical engine itself. Every surface pushes the AI reasoning forward — flash alerts, scenario trees, timeline events, management-rhetoric deconstruction. Built to prove the depth and defensibility of the analysis.

Prototype 1 — dark-themed AMC Entertainment scorecard header with a CCC+ Pulse Rating, a red material-risk advisory about interest exceeding EBITDA, and four financial tiles for total funded debt, lease obligations, cash on hand, and stockholders' equity.
v1 header. Every major signal compressed into a single above-the-fold view — rating, risk headline, balance-sheet tiles, next catalyst.
Prototype 02 · Publication-Grade

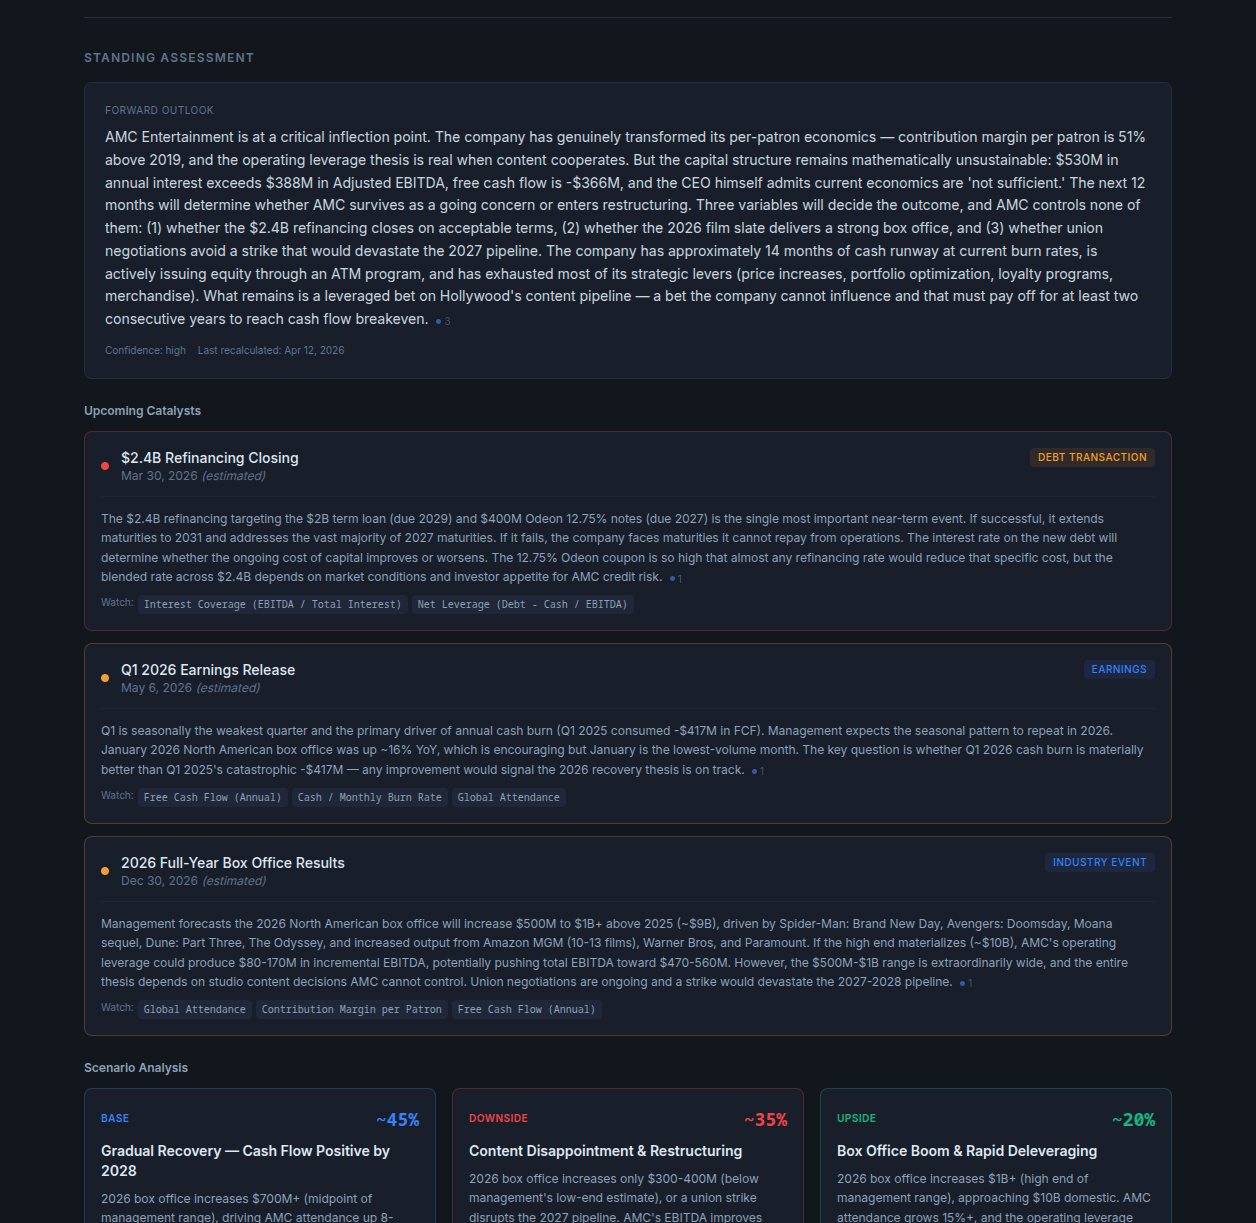
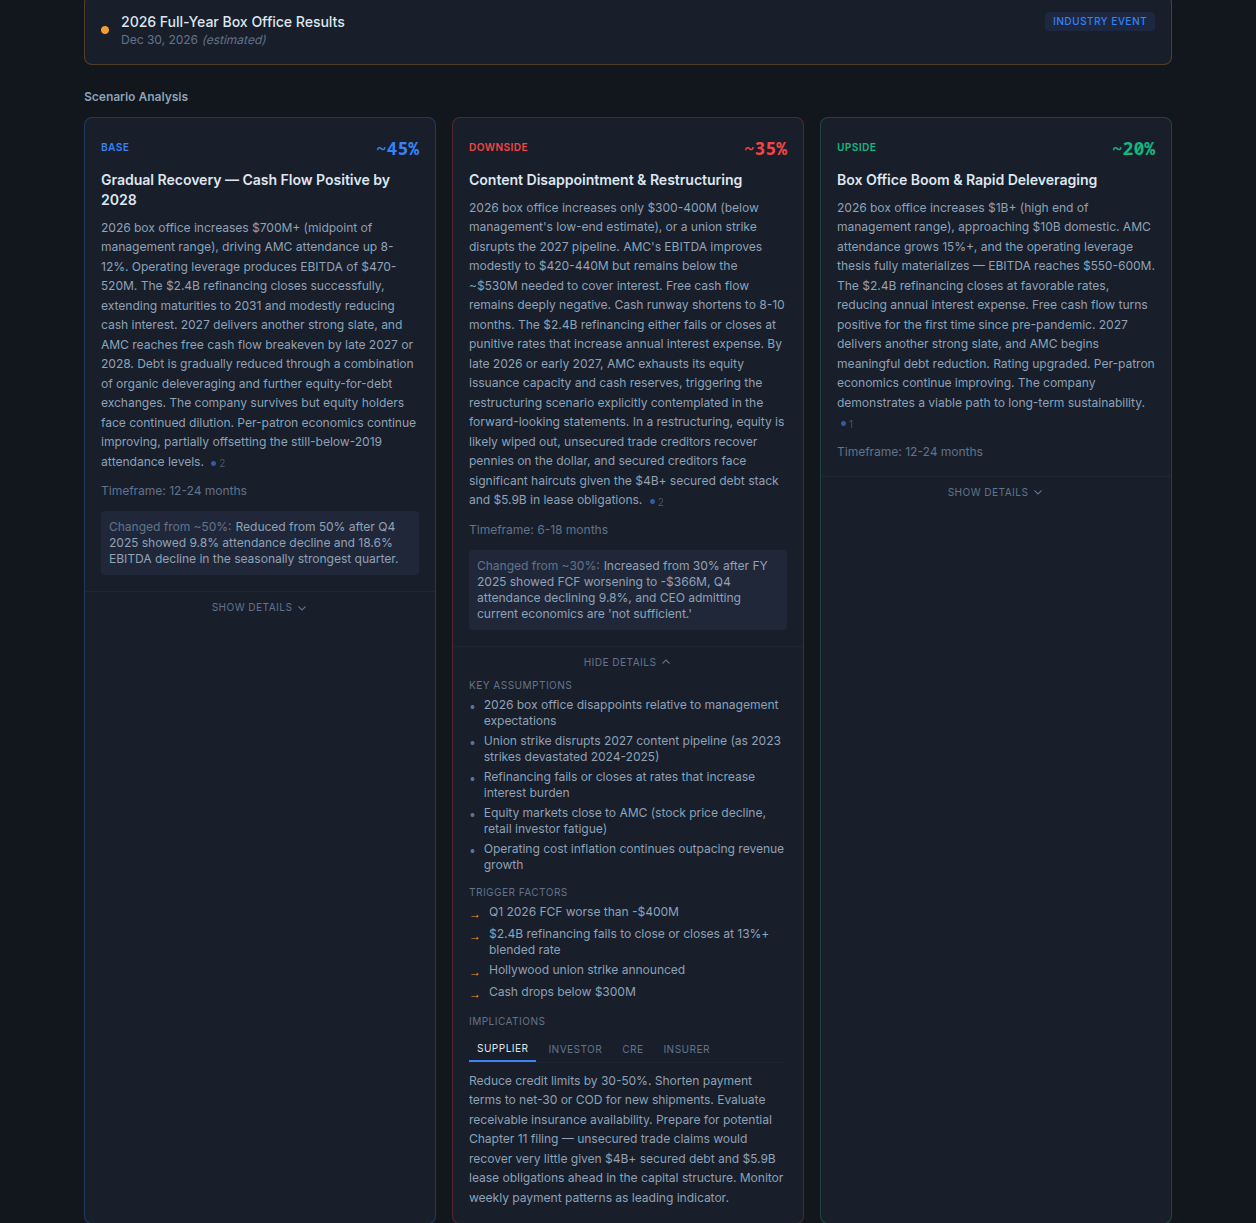
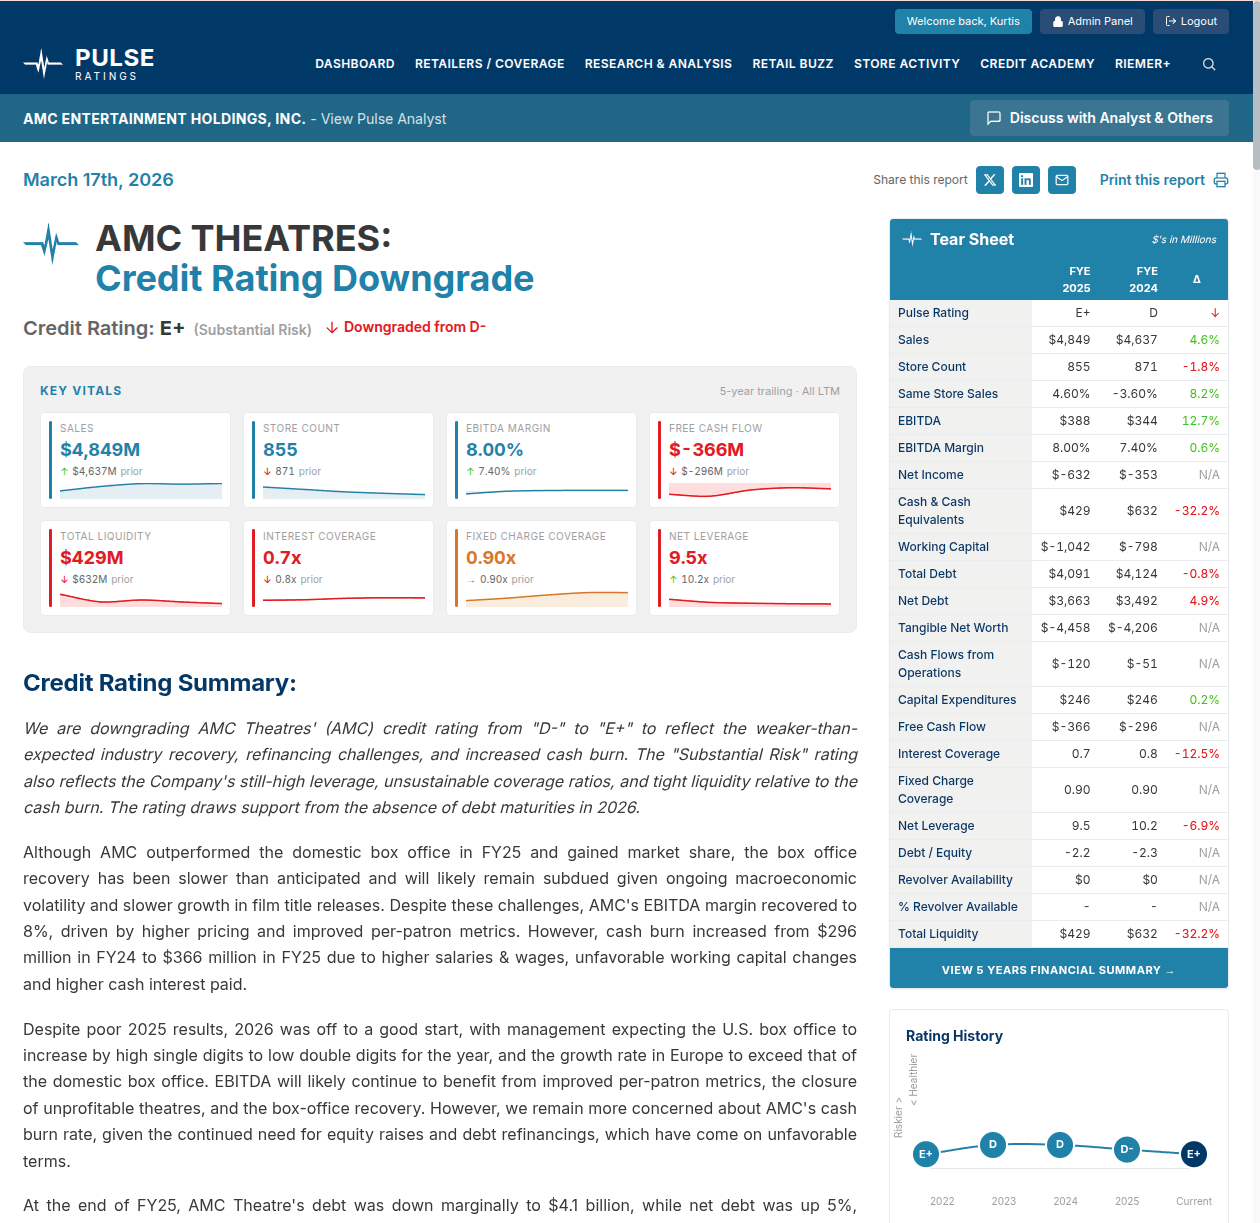
The same engine, wearing the client's brand.

Light, editorial, dropped inside the client's existing research publication — complete with navigation, tear sheet, rating history, related coverage, and sidebar alerts. The analytical engine is identical. The product around it is something subscribers would recognize as theirs.

Prototype 2 — light-themed Pulse Ratings publication page with top navigation (Dashboard, Retailers / Coverage, Research & Analysis, Retail Buzz, Store Activity, Credit Academy), a title 'AMC Theatres: Credit Rating Downgrade', the E+ rating and downgrade from D-, a key vitals grid, a tear sheet sidebar, and the opening of the credit rating summary.
v2 header. A published credit report with a tear sheet, rating history chart, and the voice of an existing research brand.
Why two prototypes

The first prototype is the pitch: this is what the engine can do. The second prototype is the product: this is what it looks like in your business. Splitting those two conversations let the client see both the ambition and the path to shipping — without collapsing one into the other.


The Problem

Credit analysis is deep work,
but readers want it in minutes.

A credit-research publication with a subscriber base of credit professionals, suppliers, and investors had a problem familiar to any specialist publisher: every real opinion requires hours of filing-digging, earnings-call transcription, news triangulation, and quantitative modeling — and those hours don't scale.

The analysts knew what a good credit report looked like. They'd been writing them for years. What they wanted was a system that could do the grunt work — read the 10-K, map the debt stack, compare quarter-over-quarter guidance, surface the management rhetoric that deserves scrutiny — and hand them a draft that was already 90% of the way there.

They'd watched the market fill up with generic "AI summarizers." None of them were built for credit work. None of them knew the difference between a 9-month cherry-picked free-cash-flow window and a full-year FCF figure. None of them could reason about operating leverage, debt maturities, or management credibility as independent dimensions.

The brief was straightforward on paper and hard in practice: build the AI engine a credit analyst would actually trust, and ship it inside the publication their readers already use.


Prototype 01 · Engine-First

A dark, dense AI workstation —
built to show how deep the engine goes.

The first prototype was designed backwards from the engine. Every section exists because the analytical pipeline produces something worth showing. It doesn't try to look like anything the client already ships. It tries to look like the most ambitious version of what an AI-native credit workstation could be.

01

Pulse Rating + Flash Alert

A single headline rating with outlook, prior rating, and a top-level material-risk advisory summarizing the dominant concern.

02

Key Vitals Grid

Interest coverage, free cash flow, monthly burn, net leverage, contribution margin — each with trend arrows and one-line causal explanations.

03

Event Timeline

Every earnings release, debt transaction, leadership change, content event, and pricing move — tagged, sourced, and expandable into full analysis.

04

Scenario Analysis

Base, Downside, Upside scenarios with probability weights, trigger factors, key assumptions, and stakeholder-specific implications (supplier, investor, CRE, insurer).

05

Deep-Dive Data Tabs

Capital structure, interest coverage trend, per-patron economics, debt maturities, seasonal patterns, share dilution, guidance evolution — all charted from the same underlying data.

06

Management Rhetoric Analysis

Claim-vs-reality teardown of earnings-call statements, with tagged patterns: selective emphasis, per-unit framing, denominator manipulation, cherry-picked windows.

Prototype 1 event timeline — a vertical feed of 11 timestamped events ranging from the FY 2025 earnings release and the $2.4B refinancing through a CEO stroke, Taylor Swift concert film, Netflix Stranger Things finale, and NCM advertising deal. Each event is tagged by type (earnings, debt transaction, leadership change, content event, partnership, pricing strategy) and has an urgency marker.
Event timeline. Every material event the company's been through, tagged by type and urgency, ranked chronologically, and sourced.
Same event timeline with the top event expanded into a full analysis — FY 2025 revenue and EBITDA numbers, a narrative analysis paragraph, prior context, forward implications, scenario impact with probability shifts from 50 to 45 percent and 30 to 35 percent, and a Management Rhetoric Analysis section with claim-vs-reality teardowns tagged selective_emphasis, per_unit_framing, and denominator_manipulation.
Event, expanded. Every item opens into a full analytical block — narrative, prior context, forward implications, shifted scenario probabilities, and a claim-vs-reality teardown of the management language around it.
Prototype 1 Standing Assessment block — a forward-outlook narrative paragraph about AMC's capital structure, upcoming catalysts (the $2.4B refinancing closing on March 30, 2026, Q1 2026 earnings release on May 6, and 2026 full-year box office results on December 30), and the start of a Scenario Analysis section showing Base 45%, Downside 35%, Upside 20% cards.
Standing assessment + catalysts. A written credit opinion ends by pointing at the three or four events that will move it next — each one linked to the specific vitals they'll affect.
Prototype 1 scenario analysis — three side-by-side cards for Base (45%), Downside (35%), Upside (20%) scenarios with titles 'Gradual Recovery Cash Flow Positive by 2028', 'Content Disappointment and Restructuring', and 'Box Office Boom and Rapid Deleveraging'. The Downside card is expanded showing key assumptions, trigger factors, and implications tabs for supplier, investor, CRE, insurer, with the supplier view explaining to reduce credit limits by 30-50 percent.
Scenarios with stakeholder views. Each scenario has trigger factors, key assumptions, and — critically — a separate implications panel for suppliers, investors, CRE landlords, and insurers. The same scenario, four different action plans.
Prototype 1 Deep-Dive Data tab set, with 14 tabs visible including Capital Structure, Interest Coverage Trend (selected), Per-Patron Economics Trend, Attendance and Screen Count, Cash Flow and Liquidity, Segment Performance, Financial Summary, Share Count and Dilution History, Guidance Evolution, Competitive Landscape and Market Position, Records and Operational Milestones, Debt Maturities, Lease Maturities, Cash Flow Bridge, Seasonal Pattern, and Mgmt Assessment. The chart shows quarterly Adjusted EBITDA vs interest expense bars for Q1 through Q4 2025 with coverage ratios of -0.53x, 1.73x, 1.03x, and 1.10x.
Deep-dive tabs. Fifteen independent analytical views of the same dataset, each charted from source filings.
Seasonal Pattern tab showing four quarterly cards — Q1 weakest with FCF negative $417M, Q2 strong summer with FCF +$89M, Q3 moderate with FCF negative $81M, Q4 strong holiday with FCF +$43M. Below is a credit-implication block about the seasonal cash crisis suppliers should consider when setting payment terms.
Seasonal pattern. Every deep-dive tab closes with a plain-English credit implication — so the chart isn't just a chart, it's a decision input.
Prototype 1 Management Assessment tab — credibility rating of LOW, communication-style paragraph describing the CEO as 'aggressively promotional', and six tagged key patterns including cherry-picked 9-month FCF windows, rebaselined debt-reduction claims, systematic omission of total debt and interest expense in prepared remarks, and promotional content (Taylor Swift, Hycroft) crowding out financial fundamentals on earnings calls. Closes with an analyst note that the earnings call should be treated as a promotional exercise and the 10-K/10-Q are the essential documents.
Management rhetoric. A credibility rating plus six tagged patterns the AI flagged in the call transcripts — with an explicit analyst-use-note at the bottom.
Prototype 1 Guidance Evolution tab showing management's quarterly forecasts for five metrics — 2025 Domestic Box Office, Free Cash Flow Positive Target, Cumulative Debt Reduction Claim, XL Screen Deployment Targets, and 2026 Box Office Outlook — tracked across Q1, Q2, Q3, and Q4/FY, with Pulse's written assessment of how each guidance metric shifted definitions, baselines, or timeframes between quarters.
Guidance evolution. How management's forecasts have shifted quarter over quarter — rebaselined debt figures, cherry-picked FCF windows, escalating box-office language — tracked as a credibility signal.
What prototype 1 proved

The engine could do the work. It could ingest filings, classify events, score management credibility, model scenarios, and write analyst-grade prose — all from public sources, all cited, all reproducible. What it couldn't do yet was fit into a real business.

From prototype to product
Prototype 02 · Publication-Grade

The same engine,
re-skinned as the client's flagship report.

With the engine validated, we re-wrapped it inside the client's own publication system — shared navigation, shared brand, shared editorial voice, shared reader expectations. The analytical output is identical. The product around it is something subscribers would immediately recognize as part of the same house.

Prototype 2 full page — Pulse Ratings top navigation with Dashboard, Retailers/Coverage, Research & Analysis, Retail Buzz, Store Activity, Credit Academy sections; a 'View Pulse Analyst' secondary header; the article title 'AMC Theatres: Credit Rating Downgrade' with the E+ rating, a 'Downgraded from D-' badge, a Key Vitals grid of eight financial tiles with sparklines, and a Tear Sheet sidebar showing FYE 2025 vs FYE 2024 with deltas and a Rating History line chart.
Full report page. The engine's output slots directly into the client's publication shell — navigation, metadata, share buttons, tear sheet, rating history, and related-coverage sidebar, all consistent with every other report on the site.
01

Rating Action Headline

A familiar credit-research framing: current rating, prior rating, direction of movement, and risk category — the first thing any credit professional looks for.

02

Tear Sheet

A sidebar-pinned 25-line tear sheet comparing current-year vs prior-year values for every standard credit metric, with percentage deltas color-coded as favorable or unfavorable.

03

Rating History Chart

A 5-year chart of the publication's own rating over time — so readers instantly see trajectory, not just the current letter grade.

04

Structured Sections

Credit Rating Summary, Quarterly Summary, Short-Term Outlook, Long-Term Outlook, Store Activity Analysis, Management Guidance Tracker — the standard rhythm of a credit report.

05

Interactive Scenario Explorer

A live model with Short-Term, Long-Term, and Stress-Testing tabs — readers move sliders for box-office change, refinancing outcome, and attendance, and watch the implied Pulse Rating recalculate in real time.

06

Cross-Linked Coverage

Sidebar links to related reports, news & events, industry credit watches, and alert flows — the engine's output behaves like every other article in the publication.

Prototype 2 body showing the Quarterly Summary section — full narrative paragraphs analyzing Q4 results, margin performance, segment performance, an Interest Coverage Trend bar chart of quarterly Adjusted EBITDA vs interest expense, a Short-Term Outlook section, and a sidebar with five sparkline mini-charts tracking revenue growth, total sales, EBITDA margin, free cash flow, and net leverage across five years, plus a Related Coverage panel.
Quarterly summary + rolling 5-year sidebar. Long-form written analysis on the left, quick-glance trend sparklines pinned on the right — the standard rhythm of a well-designed credit report.
Prototype 2 body continuing into Short-Term Outlook and Long-Term Outlook sections with multi-paragraph analysis of the $2.4B refinancing, the 2023 Hollywood strikes, per-patron economics vs EBITDA-per-patron, and the studio content pipeline. The sidebar shows related coverage and a News & Events feed with five timestamped events tagged as earnings, debt transaction, content event, and leadership change.
Long-form written outlook. The same engine that powered the dark prototype's scenarios generates publication-voice prose in v2 — grounded in the same numbers, sourced to the same filings.
Prototype 2 Store Activity Analysis section with paragraphs analyzing AMC's 213 closures and 65 openings since 2020, market position as the largest US exhibitor at 25%+ market share, premium-format screen counts, and a Competitive Position & Market Share card showing US market share bars (AMC 25%, Regal 15%, Cinemark 15%), loyalty ecosystem metrics (39M Stubs households, 51% share of US attendance), premium format counts, and a Pulse Take callout about dominance not solving the capital structure problem.
Operational analysis with 'Pulse take' callouts. Structured data blocks — market share, premium formats, loyalty ecosystem — each followed by a one-paragraph editorial verdict in the publication's voice.
Prototype 2 FY 2025 Records & Operational Milestones panel listing per-patron records (US Admissions Revenue per Patron $12.31, F&B Revenue per Patron $7.95, Total Revenue per Patron $22.26) and 13 operational milestones from the year with dates, followed by a Pulse Take that these achievements don't solve the capital-structure problem, then the opening of the Management Guidance Tracker table.
Records & milestones — with commentary. Every data block closes with a 'Pulse take' — the engine's short editorial verdict on what the numbers actually mean for the rating.
Prototype 2 Management Guidance Tracker table — a wide table tracking four metrics (2025 Domestic Box Office vs 2024, Free Cash Flow Positive Target, Cumulative Debt Reduction Claim, 2026 Box Office Outlook) across Q1, Q2, Q3, Q4/FY columns, with a Pulse Assessment column on the right tagging each row ELEVATED, CRITICAL, CRITICAL, or ELEVATED with paragraph-long explanations of how management shifted definitions, baselines, and timeframes.
Management guidance tracker. The same quarterly-shift analysis from v1, restructured as a publication-grade table with an explicit Pulse Assessment column per row.
Prototype 2 Scenario Analysis section with tabs for Short-Term Explorer, Long-Term Explorer, and Stress Testing. The active view shows an interactive form with Base Case/Downside/Upside scenario selectors, sliders for 2026 Domestic Box Office delta (+$700M), refinancing outcome (Closes at 10-12%), 2026 attendance change (+8%), contribution margin growth (+3%), and FY2026 cash interest expense (+$500M). A live-updating projected outcomes panel on the right shows Projected FY26 Adjusted EBITDA $549M, Projected FCF -$191M, Interest Coverage 1.10x, Net Leverage 6.57x, Cash Runway 33 months, and an Implied Pulse Rating of D+.
Interactive scenario explorer. Readers aren't told 'here are our three scenarios.' They're handed the model itself — move the sliders, watch the rating change, read the engine's plain-language summary of the assumptions they just made.
Prototype 2 Analyst Commentary — Management Assessment section expanded, showing a LOW credibility rating, a Communication Style paragraph, six Key Patterns with bullet markers explaining selective emphasis on per-patron metrics, one-way operating leverage framing, cherry-picked FCF windows, comparison-period selection, promotional content crowding out fundamentals, and buried restructuring language. Closes with an Analyst Note about how to use the earnings call vs the 10-K. Below is a Source Index with 10 sources.
Analyst commentary + source index. Management rhetoric analysis repositioned as 'Analyst Commentary' — voice-appropriate for the publication, with a full source index so every claim is traceable to a public document.

Under The Hood

One analytical engine.
Two completely different products.
Built on Alera.

The same fleet of specialist agents powers both prototypes. The engine doesn't know whether it's rendering into a dark AI-forward workstation or a light publication-grade report — it just produces structured, sourced, analyst-grade credit intelligence. The presentation layer is a separate concern.

  1. 01

    Filing ingestion & fact extraction

    Agents read 10-Ks, 10-Qs, 8-Ks, earnings-call transcripts, and investor presentations. They extract structured facts — revenue, EBITDA, debt stack, maturity schedule, share count — and store every number with its source document and the specific sentence it came from.

  2. 02

    News & industry signal triangulation

    A separate research agent tracks public news, rating-agency actions, and industry reports. Events are classified by type, tagged by material-negative / neutral / material-positive sentiment, and cross-referenced against the company's own disclosures.

  3. 03

    Management rhetoric analysis

    Transcripts are passed through a credibility pipeline that identifies selective emphasis, denominator manipulation, cherry-picked comparison windows, and quarter-over-quarter rebaselining of guidance — each tagged, cited, and rolled up into a credibility rating.

  4. 04

    Scenario & rating synthesis

    A modeling agent generates Base / Downside / Upside scenarios calibrated to the company's cost structure and capital stack. An implied rating drops out of the model — and in v2, the same model powers the live scenario explorer's slider-driven re-rating.

  5. 05

    Voice-adaptive rendering

    The last step is the one that changed between prototypes. A composition layer reads the structured analytical output and writes it up in a target voice — AI-workstation in v1, publication editorial in v2. Swapping voice doesn't require rebuilding the engine. It just requires a different composition agent.

  6. 06

    Alera keeps the agents in sync

    The whole pipeline runs on Alera — our AI-native platform. Agents invoke each other, flows version themselves, grading rubrics score the outputs, and the optimization pipeline improves the prompts over time without manual tuning. Every report is reproducible from its source inputs.

Results

What the engine gave them.

2

prototypes from one engine — the ambition pitch and the shippable product, without rebuilding either

15+

deep-dive analytical views per company — capital structure, interest coverage, per-patron economics, seasonal patterns, guidance evolution

100%

sourced — every number, claim, and citation traceable to a public filing, transcript, or news article

Any

public retailer or company — the engine is domain-agnostic; AMC was the demonstration, not the ceiling


Work With Us

If your publication
has deep editorial expertise
and not enough hours —
we can help.

Pulse Ratings is one of many systems we've built for clients on Alera. If you've got a research workflow that could be 10× faster without losing a single ounce of rigor, we'd love to talk about it.

Start a conversation See the platform